Reports Tab
Productivity Automator supports reporting capabilities. The Reports tab is located on the main toolbar. Selecting this tab displays the Insights tab, which is a report that looks at Productivity Automator’s execution activity. Next to the Insights tab is the Failures tab, which show a high-level analysis of number of failures, the aggregated action summary message, rules with highest failures and more. Regardless of which tab you select, reports can be scheduled for delivery to you at any time.
Insights
For a given rule, this report shows the rule’s success rate, the number of PNRs that have been actioned, the number of times the rule has executed, the PCC(s) targeted by the rule, and the overall time saved.
Rule reports can be viewed on the Reports tab, and downloaded for further analysis.
Note: Currently, the reporting functionality does not work on Chrome’s incognito mode. If unable to access the reports, confirm incognito mode is not enabled.

View Insights reports
To view a list of reports:
-
Click the Reports tab.
-
Click the Insights tab.
-
Select the Calendar Date button to select a date or date range to view reports. The default is 90 days. Up to 365 days can be chosen.
-
Presets list a range of options to choose from. Click More at the bottom to display a full list.

-
Select Custom to enter a date range.
-
Enter the page range manually, for example, 2023/11/01 - 2024/02/07, or
-
Click the Calendar icon
 to select dates from a calendar display.
-
-
-
Select the PCC button to select a PCC from the drop-down list to display a report from the associated PCC. The default is any value, which displays reports from all PCCs.
-
Select the Rule Name button to select a rule from the drop-down list. Enter a rule name in the Rule Name field. The default is any value, which displays all rules.
-
Select a report from the Active Rules List table.
-
Sort the reports by the column headers. Click the Ascending/Descending icon
 to have the option to sort by ascending
  or descending
  values, numerically or alphabetically.
 -
Select the Column Options icon
 to select:
-
Freeze - freezes the table in the order of the selected column. Click Unfreeze undo the freeze action.
-
Copy Values - copies the values in the selected column.
-
Autosize All Columns - adjusts the column widths to display the columns to fit on the screen.
-
Reset All Column Widths - adjusts all columns to their default size.
-
-
Select the table options in the top right corner of the table:
-
The time display indicates the last time the reports were generated.
-
Click the Reload icon
 to regenerate the table based on the current values.
 -
Click the Show/Hide Filters icon
 to display or hide the Calendar Date, PCC, and Rule Name filters.
 -
Click the Action icon
 to:
to:-
Select the Clear cache and refresh icon
 to clear the system data cache and refresh the Active Rule List table based on the values in the filters.
 -
Select Download to download report data.
-
Select Schedule delivery to automatically deliver a report.
-
Select the Reset filters icon to remove any values in the filter fields and set them to the default values.
-
-
-
-
Review the totals at the bottom of the table for:
-
Total Time Saved
-
Rule with Greatest Time Saved
-
Number of Active Rules
-
Overall Success Rate
-
Total Successful Processed PNRs
-
Download Insights reports
You can download data in different formats by hovering over the three dot action menu on the top right of data card.
![]()
Download of a full report in the following formatswith any report:
-
TXT
-
Excel
-
CSV
-
JSON
-
HTML
-
Markdown
-
PNG

Failures
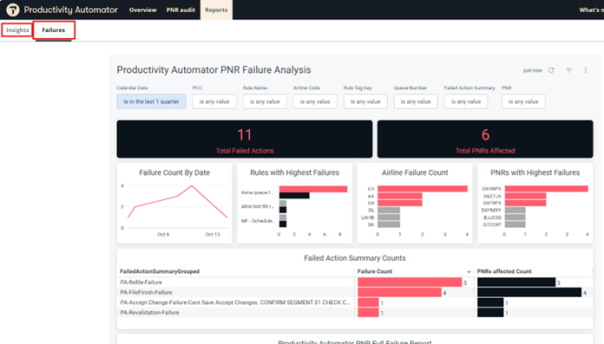
The Failures dashboard includes tiles to show a high-level analysis of number of failures, the aggregated action summary message, rules with highest failures and more. This report can be filtered to show data for a specific period, PCC, rule name, airline code, rule tag key, queue number, failed action summary and specific PNR’s.
View Failures reports
To view a list of reports:
-
Click the Reports tab.
-
Click the Failures tab.
-
Select the Calendar Date button to select a date or date range to view reports.
-
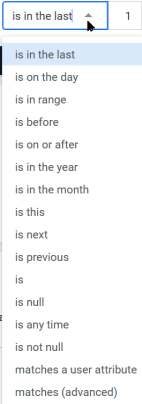
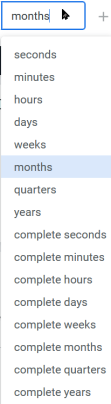
is in the last lists a range of options to choose from, with a secondary list to chose the timeframe. Click the + to add additional conditions
-
Select Matches to enter a specific value.
-
-
Select values in the PCC drop-down menues to select one or more PCCs. The default is any value, which displays reports from all PCCs.
-
Select values in the Rule Name, Airline Code, Rule Tag Key, Queue Number, Failed Action Summary, and PNR drop-down menues to select one or more values that display in the report. The default is any value, which displays all items.
-
Optionally, select one or more of the following buttons:
-
 Reload button updates and refreshes the data based on the selections in the filter categories.
 -
 Show/Hide Filter button displays or hides the filters.
 -
 Action button lets you choose the following actions:
-
Clear cache and refresh the data
-
Download the reports
-
Reset the filters to remove any values in the filter fields and set them to the default values.
-
-
-
Review the failure summaries and failed action summary counts:
-
Failure Count by Date
-
Rules with Highest Failures
-
Airline Failure Count
-
PNRs with Highest Failures
-
-
Select a report from the Productivity Automator PNR Full Failure Report table.
-
Sort the reports by the column headers. Click the Ascending/Descending icon
to have the option to sort by ascending or descending values, numerically or alphabetically. -
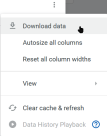
Select the table options in the top right corner of the table:
-
Click the Action icon
 to:
to:-
Download data.
-
Autosize all columns
-
Reset all column widths
-
View the Expanded report in a new window.
-
Select the Clear cache and refresh icon
 to clear the system data cache and refresh the Active Failure List table based on the values in the filters.
 -
Select the Data History Playback to see data based on time fields.
-
-
-
Download Failure reports
You can download data in different formats by hovering over the three dot action menu on the top right of data card.
Download of a full report in the following formatswith any report:
-
TXT
-
Excel
-
CSV
-
JSON
-
HTML
-
Markdown
-
PNG
Schedule Delivery
The Schedule delivery option, in either the Insights or Failures tab, delivers a report to you based on Settings, Filters, and Advanced options.
Settings tab
-
Enter a name for the report in the Schedule Name field. A different default name displays whether its an Insight or Failures report.
-
Select how often the report is delivered in the Recurrence drop-down menu.
-
Each selection has its own set of specific values to customize the delivery schedule.
-
You are also provided with the option to Send Now.
-
-
The Destination defaults to Email. Enter one or more valid email addresses. Press the Enter key to add an email address before adding another one.
-
Select which format the report will be delivered:
-
PDF
-
CSV .zip file
-
PNG visualization image
-
Filters tab
The filters tab displays the same options based on whether you are delivering an Insights or Failures report. Select which options you would like delivered.
Advanced options
The Advanced options tab lets you enter a custom message and select additional options.
-
Enter a custom message, up to 1500 characters.
-
Select whether the email message can:
-
Include links
-
Expand tables within the message body to show all rows. Large tables may render as plain text or limit displayed rows.
-
Arrange dashboard tiles in a single column to save space within the email.
-
-
Select whether to fit the reports page to the dashboard, or a number of page sizes depending on your region (like letter, legal, A4, etc.).
-
Choose a timezone for the time selected in the Settings tab.
-
Select the Test now button to test the settings, or, choose Save to save the report delivery schedule.