Using the Customizable Analytics Panes
|
|
|
Training demonstration related to this topic (click to start): |

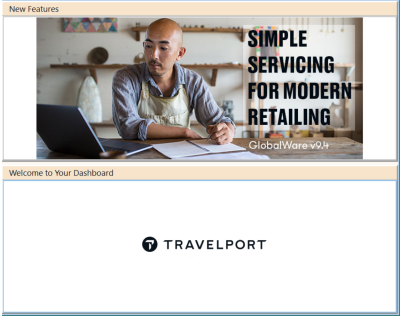
By default, the two panes on the right side of the GlobalWare dashboard display Travelport-provided graphics and pane titles.
You can customize either of these analytics panes in the following ways:
- Change the pane's image file – You can change the image displayed to another image of any standard type (for example, .jpg or .gif). While GlobalWare has up to 256 MB of data storage available for images, large images will not fit in the dashboard panes. It is recommended that you either condense image sizes to fit or size the panes to accommodate larger images. For details, see Changing the Image File below.
- Display batch data in the pane – Some GlobalWare batch processes enable you to display output data to either of the dashboard's customizable analytics panes. With the exception of batch output from the Invoice Edit & Query function, you can use these batch processes to display output data on the dashboard in a variety of chart and graph formats, such as bar graphs and pie charts. The Invoice Edit & Query function enables you to display batch output on the dashboard in a table grid format. For details, see Displaying Batch Report Data below.
IMPORTANT: Changes to the customizable analytics panes appear on all agency employee dashboards.
Changing the image file
The Preference function enables you to change the image displayed in either of the dashboard's customizable analytics panes. Use an image of any standard type (for example, .jpg or .gif). GlobalWare does not have a size limitation on images.
IMPORTANT: Images uploaded to the customizable analytics panes are visible to all users. The last image uploaded by a user overrides any previously displayed image.
If you want to revert to the original images Travelport provided, you will find the images in the Gblware folder on your computer. You indicated where the Gblware folder should be located when you installed GlobalWare. The files are NewFeatures.jpg and WelcometoYourDashboard.jpg.
To change a customizable pane's image:
-
On the System submenu, click Preferences.
Note: To access the Preferences function, your employee account profile must have Low or High permission selected under System Menu on the Employee Security screen. For more information, see Employee Security.
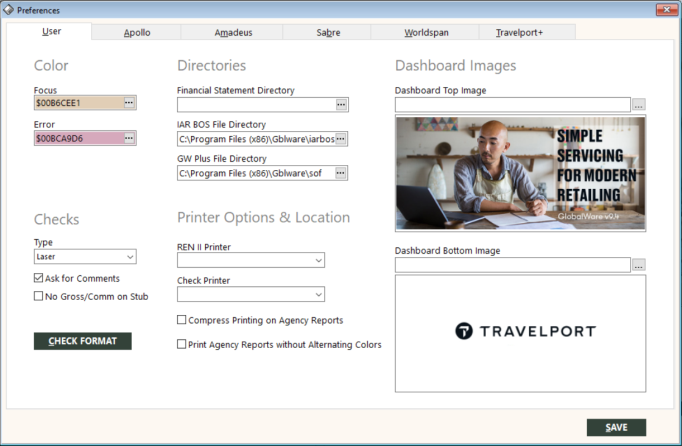
The Preferences screen appears with the User tab displayed.
-
Under Dashboard Images, click the ellipsis (
 ) button associated with either Dashboard Top Image or Dashboard Bottom Image, depending on the pane you want to customize.
 -
On the Open screen that appears, navigate to the image file to use (for example, "My Agency's Travel News.jpg"), and then click Open.
By default, GlobalWare opens the GlobalWare\GWUser folder within your local user folder (C:\Users\userfolder\GlobalWare\GWUser). It is recommended that you put the image file in this location. If you use a different location, navigate to that location.
-
On the Preferences screen, click SAVE.
-
To see the changes, press F5 while on the dashboard.
The customizable reporting pane displays the image, and the pane title bar displays the name of the image file. For example:

Displaying batch report data
Some GlobalWare batch report processes enable you to display output data to either of the dashboard's customizable analytics panes. With the exception of batch output from the Invoice Edit & Query function, you can use these batch processes to display output data on the dashboard in a variety of chart and graph formats, such as bar graphs and pie charts. The Invoice Edit & Query function enables you to display batch output on the dashboard in a table grid format only.
Note: You can remove batch data from the customizable analytics panes by using the Batch Maintenance function. For more information, see Removing Batch Report Data.
The following table lists the functions and reports that enable you to direct batch output to either of the customizable analytics panes.
| Function or Report | Method of Directing Batch Output to Dashboard |
|---|---|
|
Accounts Receivable Reports |
In the Accounts Receivable Reports dialog box, select the Show Chart/Graph check box, select a graph or chart type, and then click BATCH. The Show Chart/Graph check box is available only if By G/L Account or By Age of Invoice is selected in the Report Type box. For details, see Using the Chart/Graph Option below. |
|
Commission Tracking |
On the Commission Tracking screen, select the Chart/Graph check box, select a graph or chart type, and then click BATCH. For details, see Using the Chart/Graph Option below. |
|
Corp. Sales Analysis |
In the Corporate Sales Analysis dialog box, select the Show Chart/Graph check box, select a graph or chart type, and then click BATCH. For details, see Using the Chart/Graph Option below. |
|
Corporate Reports |
In the Corporate Reports dialog box, select the Show Chart/Graph check box, select a graph or chart type, and then click BATCH. For details, see Using the Chart/Graph Option below. |
|
GL Edit & Query |
On the GL Edit & Query screen, select the Chart/Graph check box, select a graph or chart type, and then click BATCH. For details, see Using the Chart/Graph Option below. |
|
Invoice Edit & Query |
On the Invoice Edit & Query screen, click BATCH TO BROWSE. For details, see Using Batch To Browse below. The Sorts & Invoices report, which is accessed by clicking SORT FOR REPORT on the Invoice Edit & Query screen, can also direct batch output to the dashboard. In the Sorts & Invoices dialog box, select the Show Chart/Graph check box, select a graph or chart type, select type, timeframe, and value, and then click BATCH. For details, see Using the Chart/Graph Option below. |
|
Sales Analysis |
In the Sales Analysis dialog box, select the Show Chart/Graph check box, select a graph or chart type, and then click BATCH. For details, see Using the Chart/Graph Option below. |
Using Batch to Browse
The dashboard's customizable analytics panes can display batch output data from the Invoice Edit & Query function in a table grid format.
To display the Invoice Edit & Query function's batch output to a customizable reporting pane:
-
On the Invoice submenu, click Invoice Edit & Query.
The Invoice Edit & Query screen appears.
-
Type or select the search criteria for the invoice query you want to perform. For information about search criteria on this screen, see Accessing the Invoice File.
-
Click SEARCH.
The Search Results grid shows the results.
-
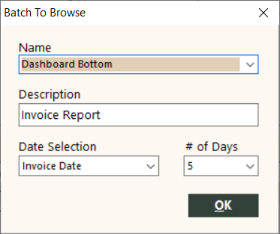
Click the BATCH TO BROWSE button. The Batch To Browse dialog box appears.
-
In the Name box, select either Dashboard Bottom or Dashboard Top, depending on the dashboard pane you want to customize.
Note: If you have other batches listed, you'll find Dashboard Bottom and Dashboard Top at the end of the list.
-
Type the following information:
- In the Description box, type a description for the batch job. This box is limited to 60 characters, including spaces. Note: This description will display in the customizable reporting pane's title bar.
- In the Date Selection box, select Invoice Date or Travel Date.
- In the # of Days box, select up to a seven-day outlook on current business. For example, if you select five days, data for the last five days (including today's date) will be used for the batch output data.
-
Click OK.
-
Close the Invoice Edit & Query screen.
-
To see the changes, press F5 while on the dashboard.
The customizable reporting pane displays the batch output data, and the pane title bar displays the batch description.

_633x413.png)
_9-3_650x385.png)
Using the Chart/Graph option
The dashboard's customizable analytics panes can display batch output data from several GlobalWare functions and reports in a variety of chart and graph formats, such as bar graphs and pie charts. For a list of functions and reports that can do this, see the table at the beginning of Displaying Batch Report Data above. For information about the charts and graphs you can use, see Chart and Graph Options.
To display batch output for a GlobalWare function or report to a customizable reporting pane:
-
Access the function or report for which you want to display batch output.
Note: The rest of this procedure will use the Sales Analysis report as an example of sending batch output to the dashboard.
For this example, on the Invoice submenu, click Sales Analysis.
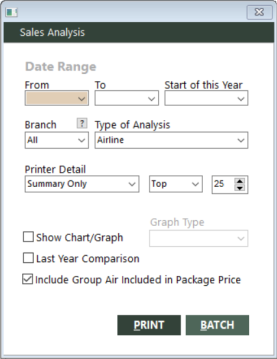
The Sales Analysis Report dialog box appears.
- Select the appropriate criteria for this report (date range, branch, and type of analysis).
- Select the Show Chart/Graph check box, and then select the desired graph type in the Graph Type box.
-
Click BATCH. The Choose a Batch dialog box appears.
-
In the Name box, select either Dashboard Bottom or Dashboard Top, depending on the dashboard pane you want to customize.
Note: If you have other batches listed, you'll find Dashboard Bottom and Dashboard Top at the end of the list.
-
Type the following information:
- In the Description box, type a description for the batch job. This box is limited to 60 characters, including spaces. Note: This description will display in the customizable reporting pane's title bar.
- In the Date Selection box, select Invoice Date or Travel Date.
- In the # of Days box, select up to a seven-day outlook on current business. For example, if you select five days, data for the last five days (including today's date) will be used for the batch output data.
- Click Ok.
- Close the Sales Analysis dialog box.
-
To see the changes, press F5 while on the dashboard.
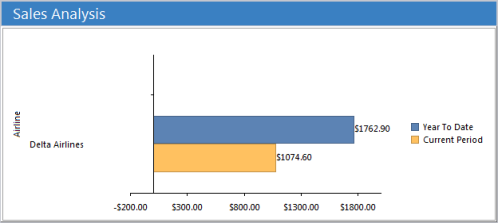
The customizable reporting pane displays the batch output data, and the pane title bar displays the batch description. For example:
Removing batch report data
To remove batch output data from a customizable pane:
-
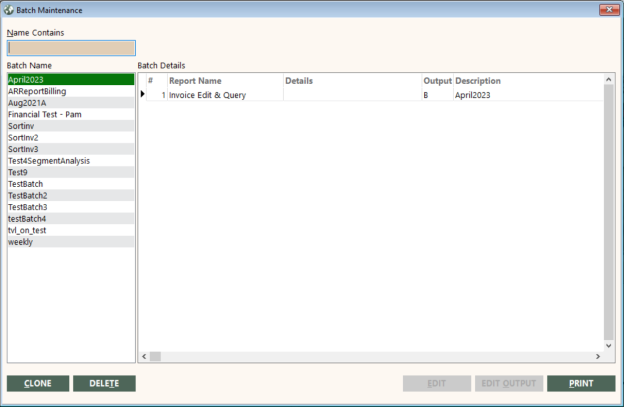
On the Tools submenu, click Batch Maintenance. The Batch Maintenance screen appears.
Note: To access the Batch Maintenance function, your employee account profile must have Low or High permission selected under System Menu on the Employee Security screen. For more information, see Employee Security.
- Under Batch Name, select Dashboard Bottom or Dashboard Top, depending on which batch you want to remove.
-
Click DELETE.
Note: GlobalWare issues this standard message for any batch name deletion request. A batch name can include more than one report.
-
Click OK.
- Click OK again to confirm.
- Close the Batch Maintenance screen.
- To see the changes, press F5 while on the dashboard.